Welcome to the Historic Earthquake Online Database
This website displays the felt effects for selected historical California earthquakes. By selecting an earthquake you can see a map of the area and intensity of shaking from that earthquake. Then by clicking on a city on the intensity map you can see what that location reported after the earthquake. These “felt reports” are usually from newspapers during the 1850 to 1930 time period. The felt reports were compiled and published in 1981* and 1982** with updates added through the years. Not all earthquakes have intensity maps and felt reports online since the conversion from printed report to web page is an on-going process. Most of the San Francisco Bay area events between 1838 and 1906 are finished.
About the Historic Earthquake Online Database
 Instructions:
 1. Click on an earthquake location to see the magnitude and date. If there are multiple earthquakes at the same location, you will see right and left pointing arrows at the top of the popup. These can be used to scroll though earthquakes.
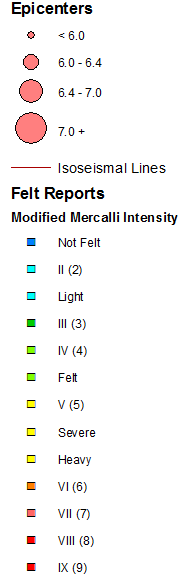
2. Use the "More Information" link to show locations of "felt reports" and IsoSeismal lines if available for the earthquake. The redder the square symbol representing one of these reports, the stronger the intensity of shaking. "Felt reports" that cannot be displayed on the map will be displayed below (in this box). When viewing these reports, the "More Information" link will have no additional result.
3. The "reset" button will clear your selections and reset the map.
The "felt reports" included in this database are measured on the Modified Mercalli Intensity (MMI) scale of 1931. For more information on how earthquakes are measured please see CGS Note 32
Isoseismal lines indicate areas of approximately equal shaking intensity. i.e. all locations on the same Isoseismal line experienced approximately equal shaking.
Background Data (Quaternary Fault Map):
The background of this map includes quaternary faults from the 2010 Fault Activity Map. Faults with activity in the past approximately 200 years are highlighted in red. Orange indicates faults with activity in the Holocene period (the last ~11,700 years). Green highlighted faults show evidence of displacement during the late Quaternary time (<700,000 years before present); and purple highlighed faults show evidence of displacement during the Quaternary (the last 1.6 million years). For more information about these data, please visit the Fault Activity Map web page.
DISCLAIMER: The State of California and the Department of Conservation make no representations or warranties regarding the accuracy of the data from which these maps were derived. Neither the State nor the Department shall be liable under any circumstances for direct, indirect, special, incidental or consequential damages with respect to any claim by any user or any third party on account of or arising from the use of this map.
*Toppozada, T. R., C. R. Real, and D. L. Parke (1981). Preparation of isoseismal maps and summaries of reported effects for pre-1900 California earthquakes, Calif. Div. Mines Geol. Open-File Rept. 81-11 SAC, 182 pp.
**Toppozada, T. R. and D. L. Parke (1982). Areas damaged by California earthquakes, 1900-1949, Calif. Div. Mines Geol. Open-File Rept. 82-17, 65 pp.

